Kathryn Gomery*, Elaine Humphrey**, Rodney Herring**
*University of Victoria, Department of Biochemistry and Microbiology, PO Box 3055 STN CSC, Victoria, BC, Canada, V8W 3P6
**University of Victoria, Department of Mechanical Engineering, PO Box 3055 STN CSC, Victoria, BC, Canada, V8W 3P6
Our research attempts to look at protein crystal quality and the nucleation process through the use of electron microscopy. Although recent research has led our current understanding of nucleation to be a two-step mechanism involving the formation of nuclei from dense liquid clusters, it’s still unclear whether nuclei first start as amorphous aggregate or as crystalline lattices. Few studies have previously looked at protein crystal nucleation and growth using electron microscopy. Using TEM and SEM imaging and diffraction of lysozyme as a model protein crystal, we report the internal twodimensional strain and density of crystallites in a protein crystal, at a resolution never seen before. SEM images reveal the protein crystal growth process proceeds in a stacking, spiraling manner, beginning from a nucleation centre that does not appear to be crystalline, while TEM diffraction shows unique features of crystal mosaicity that can be directly correlated to TEM images.
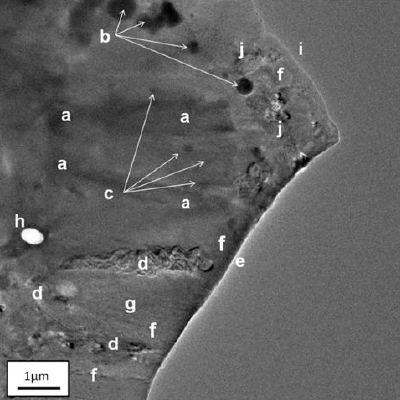
Figure 1 shows a TEM image of a protein crystal (lysozyme). There are many interesting features in the crystal, which are labelled in the figure legend. The crystal is wedge-shaped and slightly bent resulting in bend contours (marked a) due to Bragg diffraction from different atomic planes in the crystal [1]. Many small crystallites are seen within the main crystal having an area density of ~0.8 crystallites per μm2 . These crystallites ranged in diameter from 0.1 μm to 0.7 μm, with a mean size of 0.347 μm. Other features include contrast in the protein crystal due to the presence of dislocations (marked d) and some white and black banded contrast (marked j) possibly indicating the presence of stacking faults. A dislocation network is seen throughout the crystal, which varies due to a change in thickness of the crystal which thins in areas marked f, for example, towards its edge and towards a hole (marked h) in the crystal, which contributes to the thinning of the network. The hole was produced by concentrating the electron beam to a small probe that ablated the crystal.
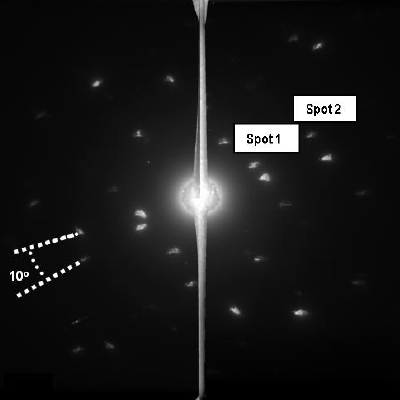
The intensity passing through the crystal shown in Figure 1 was diffracted as shown in Figure 2. Although diffraction conditions were not ideal, this diffraction pattern does show some interesting, useful features. Spots 1 and 2 are well defined diffraction spots that have an elliptical shape, due to the strain within the crystal, and their shape can be used to estimate the two dimensional (x, y) internal strain of the crystal using:
1) \(\Delta d_{x}/d_{o} = (d_{x_{1}}-d_{x_{2}})/d_{o} \)
2) \(\Delta d_{y}/d_{o} = (d_{y_{1}}-d_{y_{2}})/d_{o} \)
Where do is the intermolecular spacing of the protein crystal plane giving rise to the elliptically shaped diffracted beam, ∆dx is the distortion of the spot in the x direction and ∆dy is the distortion of the spot in the y direction. Values of 0.036 in the x direction and 0.073 in the y directions for spots 1 and 2, respectively were obtained using this method.
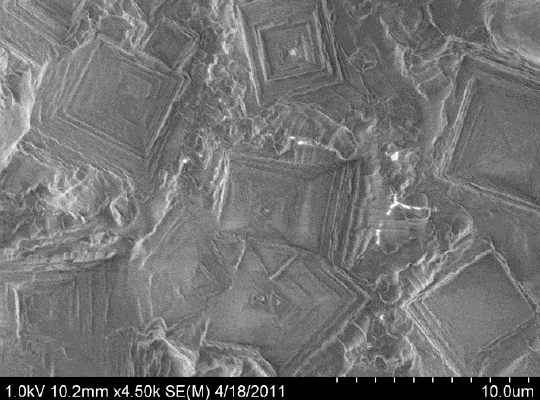
Figure 3 shows that using SEM, the nucleation and growth of lysozyme crystals was able to be observed, thereby overcoming the problems associated with viewing liquids in the vacuum of the SEM. This image, taken 12 minutes post nucleation, reveals some remarkable features. The crystals are growing in a stacking, spiraling manner, beginning from a nucleation centre that lacks flat surfaces, is round and does not appear to be crystalline.
[1] P. Hirsch et al., Electron microscopy of thin crystals., L.M.F. Butterworths/Krieger, Editor. 1965.